Insights within reach
We are a design studio for Data UX Design and Business Experience Design. We design data products and analytics applications for B2B users with high business requirements.
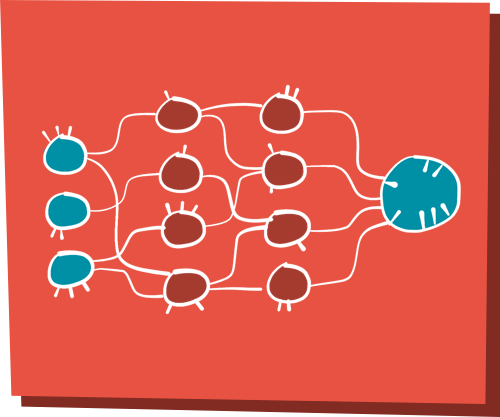
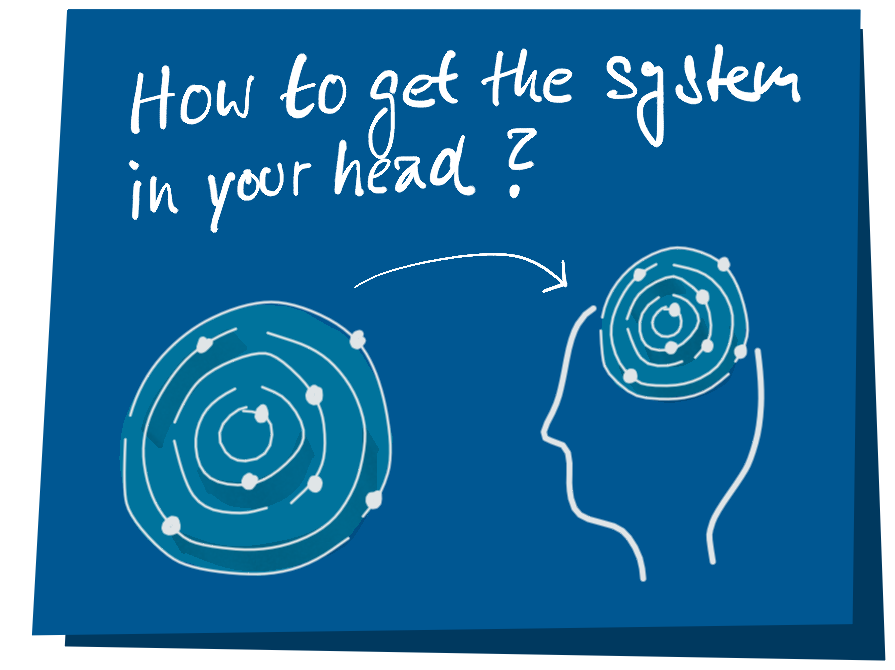
We help people to understand and control complex systems with data. Our international customers come from the fields of finance, supply chain, IoT, operations and marketing, predictive analytics, digital health, high-tech industry, SMB and software.

Data Visualization for Data Products
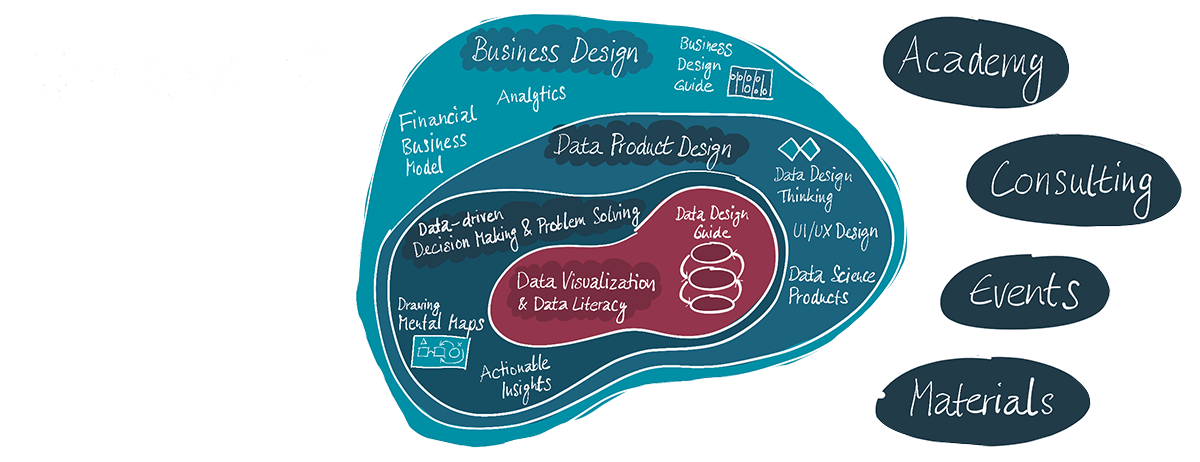
Whether robotic process automation, digitization, text mining, business analytics, IoT sensors, machine learning – data products need to be not just feasible, but also useful, understandable, trustworthy, valuable und viable. This can be achieved with Data Design. We bring our expertise in data visualization, design, data science, technology and business together. That’s why we develop data products at the highest level.
The Data Design Guide
THe FRAMEWORK FOR DATA LITERACY
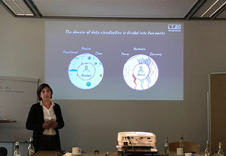
How to develop effective data visualizations? If you only have data and a tool, you won’t get very far. We start with the Cycle of Encoding and Decoding.
Since September 2019, this approach developed by us has been the basis for the Data Literacy Framework “Future Skills” in higher education in Germany. The essential point from a designer’s point of view: anyone who develops data products without considering the data literacy of their target group will probably not be successful.
Designation is in the top 5 companies worldwide that can deliver efficient training and consulting on data literacy.
In a nutshell I can highly recommend working with Evelyn when you have a complex dataset or system which you would like to visualize.
Evelyn Münster and Christoph Nieberding from Designation created a user interface for business experts and a sensational picture story to enable rapid and enduring understanding robotic processes even by AI laymen.
Many thanks for the creative and extremely valuable support! We are already looking forward to further joint developments in the field of Digital Business Development and Robots with Evelyn and Christoph.
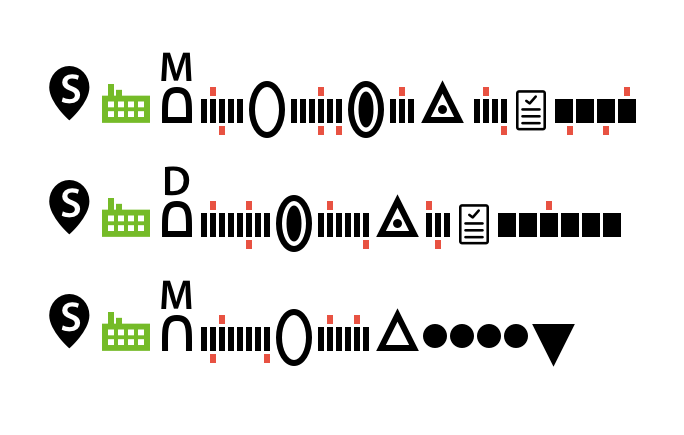
Use Case: Job Candidate Journey
A Figurative Process Analysis
The task: A personnel service provider wanted to improve the approach and interaction with its applicants. But even after all data sources had been integrated, the Business Intelligence Dashboard could not help. The solution: We developed a process-oriented visualization to analyze the applicant processes.
A Designation brand
The Chart Doktor
Data Design Academy
Learn how to turn your users into real fans with impactful data visualizations. Learn how to design groundbreaking data products that people can’t live without.

Quickly communicate concepts & ideas
Sketchnote Workshop
Today, sketchnotes are one of the most important creative and communication techniques for everyday business. Those who use sketch notes have more fun working in a team and can above all
– communicate complex ideas more quickly,
– structure projects better,
– communicate content more effectively.
Our Network Partner

Law firm for Patent- and IT-Law, München

Data Science Agency, Berlin

Auditor and Tax Consultants, München
Data Science Agency, Vienna
Events

Data Literacy Conference
France, Aix-en-Provence, Oktober 2018

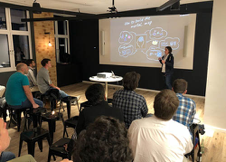
Data Geeks Data Day
Munich, November 2017
DataViz Meetup
Munich, Mai 2018
TecTalk @ crossrelations
Duisburg, Juli 2018
Our Engagement
We support the IHK München initiative Pack ma’s digital in order to support the economy in Upper Bavaria with digitisation and to secure the future of the location.
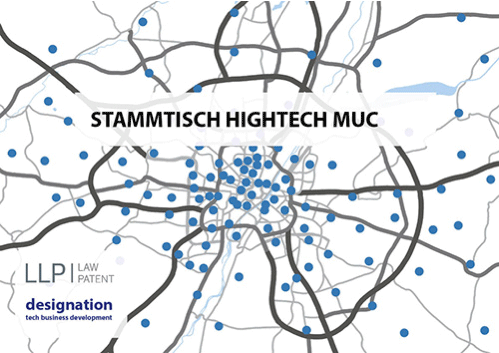
Together with the Munich law firm LLP Law and Patent, we are the initiator and organizer of the Munich Technology Stammtisch for managing directors of medium-sized companies.

We are a member of the Munich IT network commendIT. More than 50 IT entrepreneurs have been working here regularly and continuously for digital business processes based on trust since 2009.

Evelyn Münster
With a background in media art and software development, Evelyn Münster has been working as a UX & data visualization designer for more than a decade.
She is good at explaining incredibly complex things in a way that everyone understands them easily. For example data science, machine learning, robots, big data, code, statistics, processes or user journeys.
In 2016, she initiated the first scientifically based data literacy skill test.
She has been an international data visualization expert since 2014, helping technology clients develop complex and innovative data products, often based on machine learning, such as control and decision systems, tools and dashboards.
Christoph Nieberding
As a practitioner, Christoph Nieberding spent his management career in the technology and software industry until 2013, repeatedly questioning data quality, the limits of analysis tools and the existing possibilities of visual communication.
He has extensive knowledge of business processes and various management functions in the areas of finance, sales, risk management and business development.
His passion is to increase the value of visual, data-based communication, design complex data products and qualify people and communities in the field of data literacy and visual work.