Why do we need data products? Curiosity is a major driver for all of us. We are constantly carrying out research on processes, causes and effects.
We want to understand how companies, operational processes or economic relations work, what steps and parts they consist of, why something happens and how everything is interrelated.
Once we have analyzed everything, we can use this knowledge to exert influence on the world in a positive way.
Data is an increasingly important factor in the search for correlations. The right data (smart data instead of big data) shed more light on the dark. Without data, an accurate, systematic analysis and precise design of the world around us is no longer conceivable. Intuition and gut feeling alone are no longer enough.
But data in its raw version (binary, in tables, logfiles, databases, etc.) cannot actually be read by humans. If we want to go fast, we need data visualizations that make the right selection of data easily and precisely visible at the appropriate level of aggregation. This task is performed by so-called data products. They visualize our world in a suitable form and make it accessible for our analysis and our search for causes and effects.

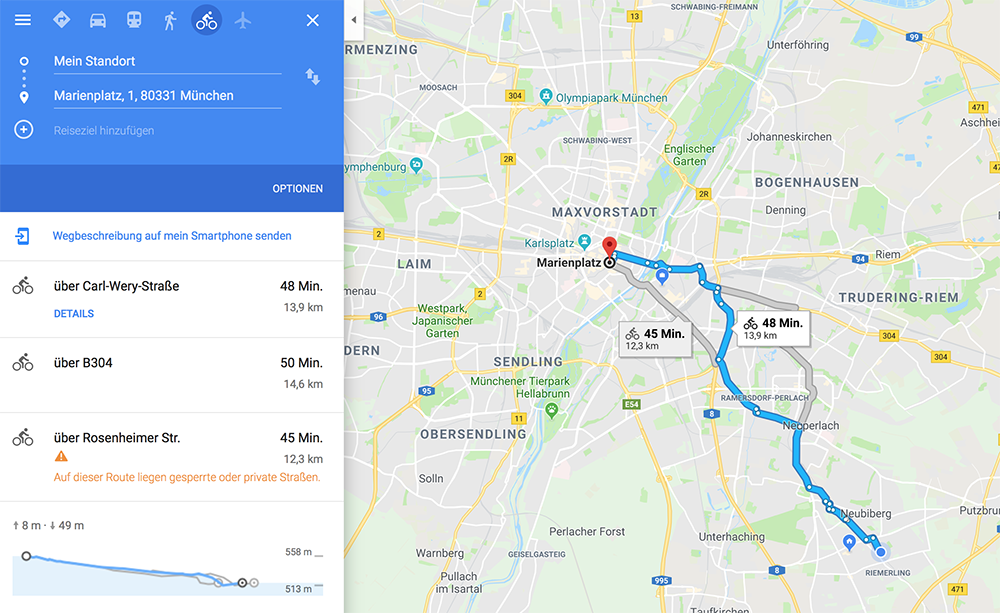
Data products such as Google Maps, Google Analytics or mobile apps for weather, health or timetables provide this for us at a really high level. What we see as a pretty, clear display is a highly complex condensation and sophisticated visual summary of data, connections and structures.
Definition
Data products are digital products that use and visualize data to support the decision-making and the control of complex systems.
A data product is a visually, with the help of algorithms processed result of a statistical, mostly complex data analysis of systems. Systems can be processes, facilities, companies, cities, countries, infrastructure, solar systems, organisms, ecosystems, climate conditions. A small hint: our world consists of an infinite number of systems.
A data product describes historical, current or future conditions and developments of this system. Users use data products to describe complex conditions and developments of systems quickly and visually and to derive information and their own decisions from them.
Design aspiration
The visual interface between machine (data product) and human being is very important.
But how exactly do you develop them? How is it ensured that they effectively fulfill their task? Especially in a professional environment, very different requirements are placed on a new data product by very different users. You find yourself quickly in a situation in which you have to solve a tricky problem (wicked problem).
Tricky problems are characterized by the following characteristics:
- there are many interdependent influencing variables
- there are no right or wrong solutions, only good and bad ones
- you can’t solve it with a formula and logic alone
- you can only solve them intuitively, not logically
- there are social, psychological and cultural aspects to consider.

The challenge with data products is…
on the content side:
- the complexity of the underlying system is high
on the data side::
- data from different data sources must be connected to each other
- the data quality is often insufficient
- the preparation of data (ETL) is complex and time-consuming
- data science techniques must be properly integrated
on the visualization side::
- the classic visualization methods (bar chart, pie chart, dot plot) are no longer sufficient
- the possibilities of visualization of common tools like Qlik, Tableau and PowerBI are limited
on the user side::
- the users have very different knowledge
- they have to do very different jobs (jobs to be done)
- Decoding the information contained in data products and assigning it to one’s own knowledge is a challenge
- they have to do very different jobs (jobs to be done)
- the working environment of the users (medical technology, system control, vehicle control) is highly complex
More details on all these aspects can also be found in our article on the Data Design Guide..
What is Design Thinking?
Design Thinking offers a very effective approach to solving tricky problems. Here, an interdisciplinary team approaches a potential solution in individual, systematic steps and from the user’s perspective. This is then tested for suitability by users.
Design Thinking has become a well-known and well-proven method of developing innovation. Many large technology and consulting companies use it.
The internet is full of practical and descriptive explanations of Design Thinking, so here is just a brief overview of the four underlying phases in the Design Thinking process.
- Discover – Discover the environment and context for the question or problem under consideration
- Define – Formulate requirements and needs of users
- Develop – Develop first ideas to the solution
- Deliver – Create a solution and get user feedback.

Design Thinking for Data Products
We wondered whether this method could also be used for data products. Design thinking is all about the user and his needs. Now another very complex dimension is added: data or respectively data science. We then adapted the classic design thinking method specifically for data products and have been working with it very successfully since the beginning of 2018.
The challenge of using Design Thinking in the development of data products for business applications lies in the following points:
- Data product development for Big Data and Data Science applications is often breaking new ground. At this point, the target use (Job To Be Done) is not clearly defined at the beginning. The context of use and user requirements must be developed equally with the data product. Sometimes they only become apparent after the first visualization of the previous invisible system.
- The data competence of the user is unknown or too low to understand the message
- Designers need a deep insight into the data structure, the raw data and the data pipeline. What is creatively developed must also be technically possible. A pure UX view is not enough.
- Many data products are based on data science algorithms. Data and the potential of statistics and data science are the raw material for the creative process. Data products only become efficient when they fully exploit this data potential. Here, too, designers cannot go any further without an understanding of data literacy and data science.
- Data products in a professional environment are aimed at users and experts in specialist fields. The data product thus intervenes deeply in so-called business domains – a further level of complexity.