Figurative process visualization
Client: Personnel service provider
Task: User journey and process analysis
Date: 2018
We developed a figurative process visualization for a leading personnel service provider.
The aim was to identify correlations and potential for improvement in the applicant process. For example, decision-makers did not know which job portal would generate the most applications, or which type of job advertisement text was the most successful. In addition, they had no feedback whatsoever on the placement rates at their locations in Germany. That’s why we wanted to get a complete look at an applicant’s user journey.
What does a typical User Journey look like for an applicant?
Each applicant first sees a job advertisement on a job portal. She applies and comes to the job agency. After a successful interview she is hired in her new job. If that doesn’t work out so quickly, the candidate is placed in the applicant pool.

The first problem was that the data for the individual steps were stored in silos and were not yet integrated. After the data integration was successfully implemented, we created a dashboard that looked something like this:

Here it could be seen that the “S” location in the Industrial business unit had consistently placed many more applicants in the job. That was quite revealing. But no matter how the data was grouped or filtered, nobody could find the reason for the higher placement rate. The management of the site was not aware of any particular factors either. Was it just a coincidence?
The problem with dashboards is that they can rarely show the influence of multiple factors simultaneously.
When filtering, you have to decide whether you want to filter by location, portal or duration of the placement. And even if there are combined filters, you always have only one view and cannot compare several filter combinations. And even if that works, only aggregated mean values are displayed instead of details. Often, however, it is the detail level where the causes first become visible.

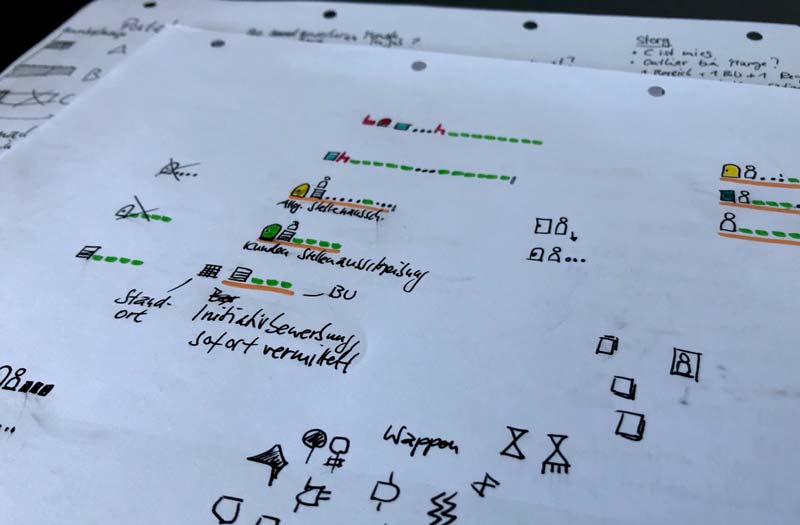
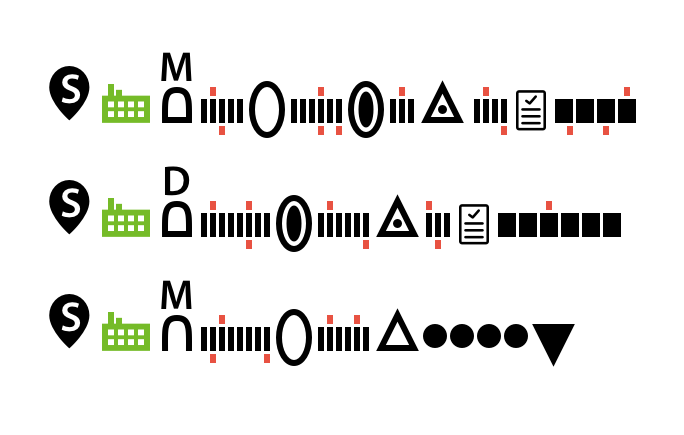
We have therefore developed a figurative data language that visualizes all available metrics in one view at the applicant level.
For each applicant one can follow the temporal application process, and use the human ability for pattern recognition, which could not be surpassed until today even by artificial intelligence.

Now we could compare the applicant processes of the locations on a detailed level with each other:


On the one hand, this visualization made it clear that location S treats the applicants of this business unit preferentially, since there were currently many vacancies and relatively few job seekers. They tried to organise an interview as soon as possible after receiving an application so that the applicant would not find a job elsewhere in the meantime.
Secondly, the communication rate via telephone and email is very high compared to other locations. An intensive support seems to keep applicants from jumping off again as well.
By the way, these process details are not visible with the visualization methods of conventional process mining tools, since they know stations, but no recurring events, and also cannot compare detailed processes.
The figurative visualization is easy and intuitive to read. As a result, not only data specialists, but also many employees from various departments were able to analyze processes and actually did so. This triggered a broad and fruitful discussion about optimization potentials.
The organization took a big step towards a data-driven corporate culture.
Since then, the tool and the data language have been continuously further developed.
By the way: The method of figurative process analysis was developed by Designation. What do you think? We are always very happy about feedback!