Data Visualization for an Online Marketing Analytics Platform
Clients: Online Marketing Companies
Task: Design and development of a comprehensive analytics platform for online marketing
Date: 2012/2013
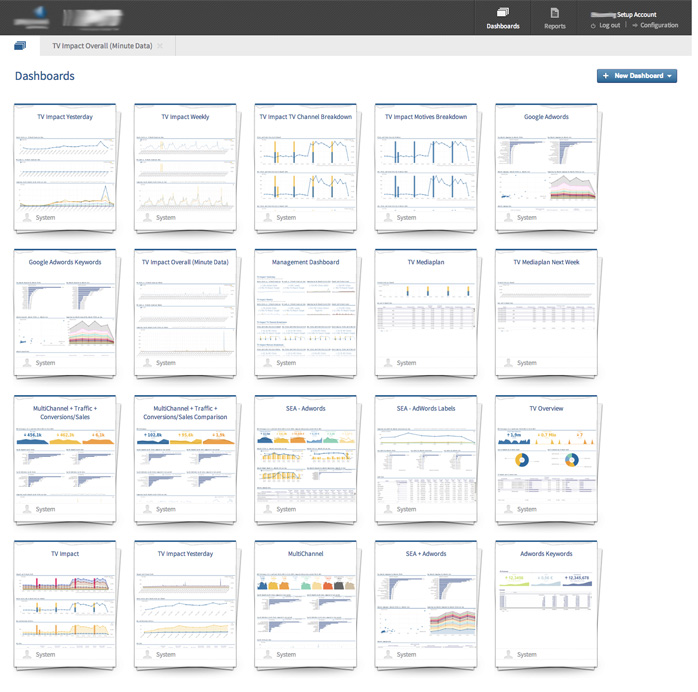
I was the leading mastermind in designing a comprehensive and highly configurable self-service reporting platform.
This business intelligence tool was specially adapted to the needs of online marketing agencies. It is flexible and quite powerful, yet has a very clear design and intuitive user interface.
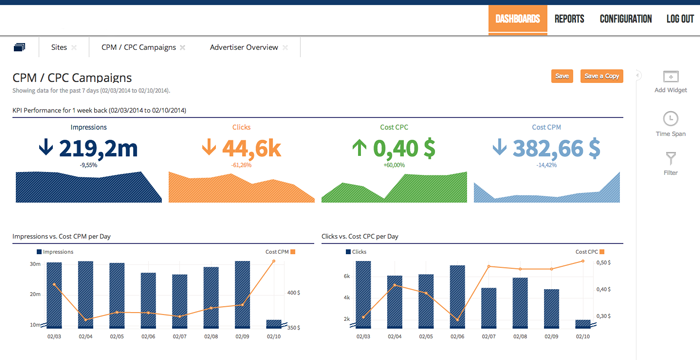
The purpose of the tool is to minimize manual effort and error sources when creating KPI dashboards, and to visualize the key messages of the data quickly and easily.
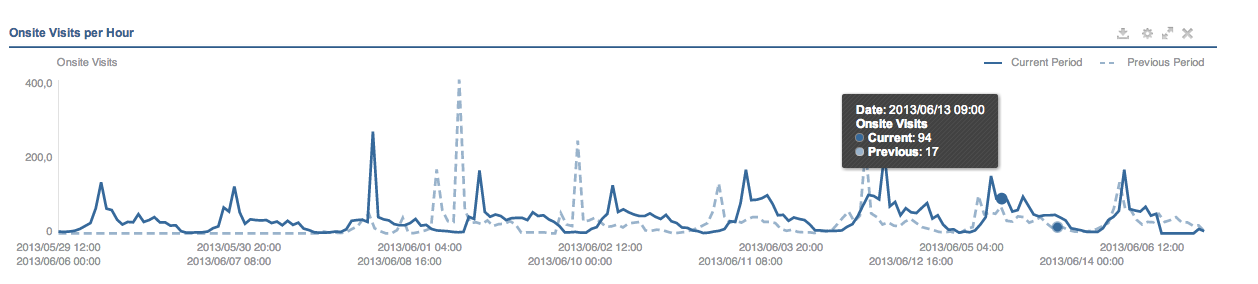
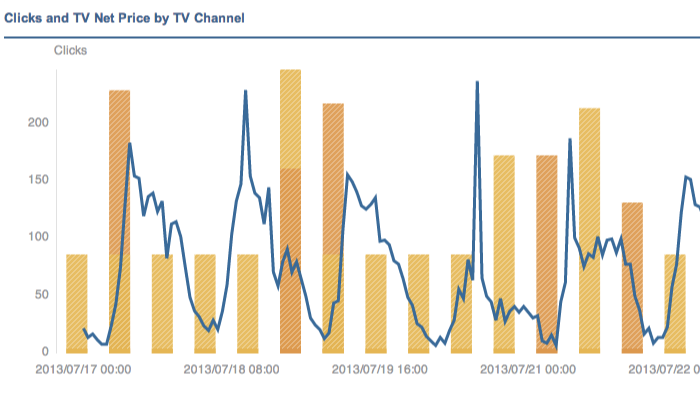
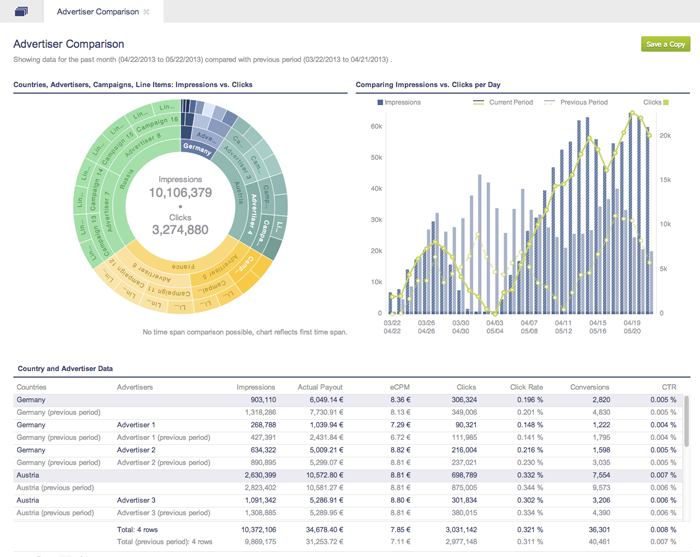
The features, all accessible through an elegant and intuitive user interface, include time span comparisons, drag and drop layout, hierarchical filters, many different chart types and a powerful data table.
Originally, our core business was the design and development of customized reporting solutions for the online marketing industry.
In order not to have to reinvent the wheel again and again, we developed a framework that implements all recurring features generically, so that they are already preconfigured and immediately available in every new product.
Now the setting up of a new tailor-made project based on the framework is quickly accomplished. This saves our customers costs and reduces project complexity.