
The pattern language for visual analytics in business
For the sake of the user, challenging the standards of Power BI is a quest in every Power BI project. Here you'll find some examples which we build as sandbox projects, free for your download. Enjoy 🥳 !
Level 1 Patterns - the visual vocabulary
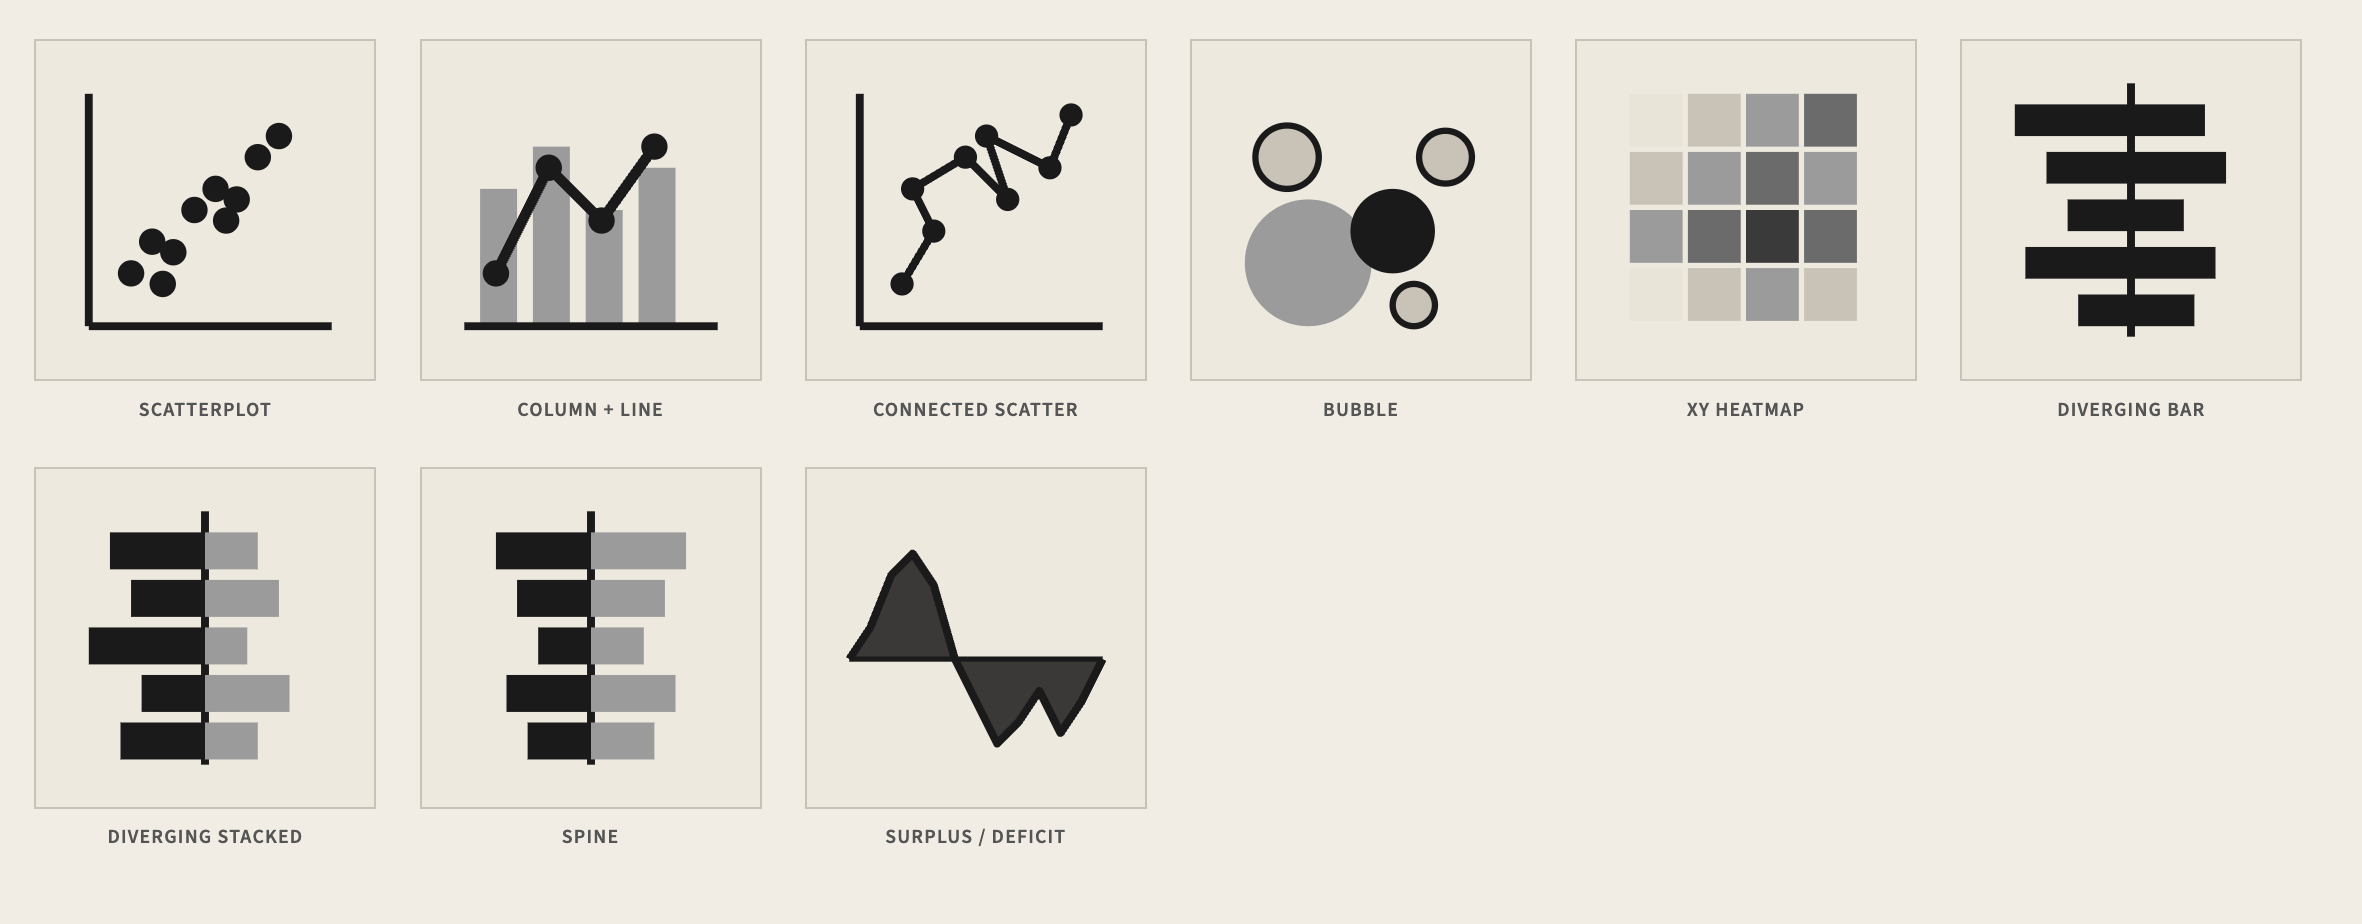
Deviation
Diverging Stacked Bar
Spine
Diverging Stacked Bar
Surplus / Deficit Filled Line
Correlation
Scatterplot
Column + line timeline
Connected scatterplot
Bubble Chart
XY-Heatmap
Ranking
Ordered Bar
Ordered Column
Ordered Column
Ordered Proportional Symbol
Ordered Proportional Symbol
Dot Strip Plot
Dot Strip Plot
Slope
Slope
Lollipop
Lollipop
Bump
Bump
Distribution
Histogram
Histogram
Dot plot
Dot plot
Dot strip plot
Dot strip plot
Barcode plot
Bar strip plot
Boxplot
Box plot
Violin plot
Violin plot
Population pyramid
Population pyramid
Cumulative curve
Cumulative curve
Frequency polygons
FREQUENCY POLYGONS
Beeswarm
Beeswarm
Change over Time
Line
Line Chart
Bar Chart
Bar Chart
Column + line timeline
Column and Timeline
Slope
Slope
Area chart
Area
Candlestick
Candlestick
Fan chart (projections)
Fan Chart Projections
Connected scatterplot
Connected scatterplot
Calendar heatmap
Calendar heatmap
Priestley timeline
Priestley timeline
Circle timeline
Circle timeline
Vertical timeline
Vertical timeline
Seismogram
Seismogram
Streamgraph
Streamgraph
Flow
Sankey
Sankey
Waterfall
Waterfall
Network
Network
Chord
Chord
Funnel
A funnel chart visualizes sequential stages in a process, such as sales pipelines. It highlights drop-offs between stages, conversion rates, and overall progression toward a final goal.
Download File (ZIP)