Building Trust in Algorithms
Customer: Leading Ad Tech Corporation
Task: Explain AI-based Bidding Strategy for Real Time Bidding (RTB)
Date: 2014
My client has developed a machine learning algorithm that can optimize RTB campaigns better than any human.
But how can you explain to a campaign manager what this algorithm does, why it always achieves the best possible result that is feasible under the chosen parameters, and why it outperforms the results of an experienced campaign manager?
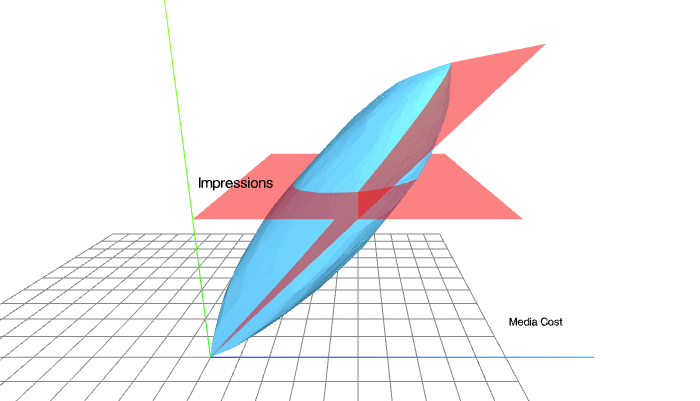
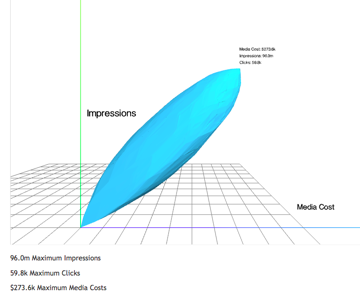
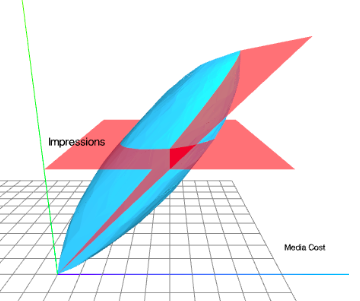
The desired visualization should make ordinary people understand how a DSP Machine Learning technology manages to achieve multiple campaign objectives by using multidimensional space calculations.
I built an explorable explanation, a 2D and 3D visual prototype. This allows you to understand the spatial possibilities of RTB auctions and the optimized bidding strategy.
That’s set theory, geometrically explained. Have you ever wondered how changing some parameters affects the result set? Or what is the best size of the result set?
With this explorable explanation, the user can visually change the parameters step by step and observe the effect. I used a 3D geometric model of the result space, and surfaces that cut and resize that space. The “aha” effect is guaranteed and the tool is being used with great success to introduce the new product.
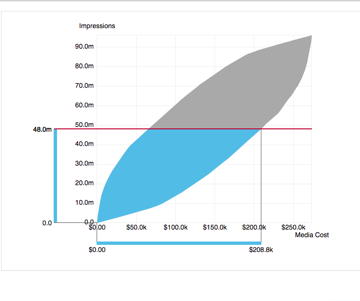
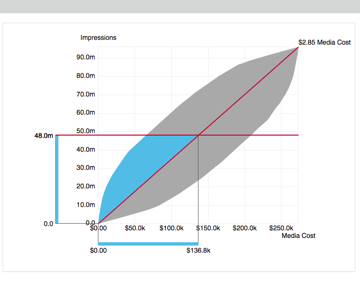
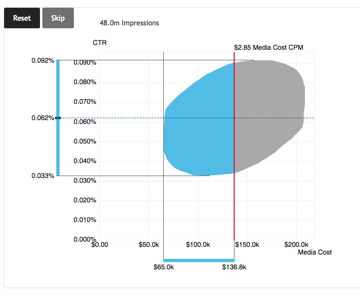
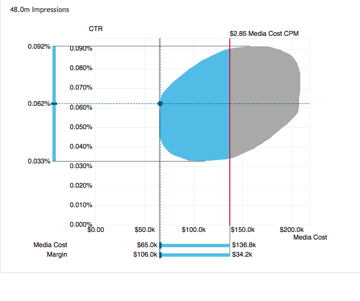
Der Nutzer kann mit dem Tools mehrere Kampagnenziele setzen. Die Maschine findet daraufhin automatisch den Sweet Spot, das heißt den optimalen Kompromiss zwischen den konkurrierenden Zielen.