ScenarioplayΒ - Building Business Models for Exploration and Management

DESIGNATION -Β Data Design with Business Relevance

Why it is important?

Hartmut Bossels is the main thinker behind the System Zoo (1). We try to apply building business scenarios by combining this with the System Zoo's classification. This way ofΒ simulation models offers a powerful, hands-on way to understand how companies and parts of them actually behave as dynamic systems rather than looking at static structures. Here's why it is relevant in practice:

Seeing feedback loops in action
Every business is full of feedback loops β€” rising sales lead to more hiring, which improves capacity, which enables more sales, or conversely, overextension leads to quality drops and customer loss. System Zoo models make these loops visible and quantifiable. Managers can literally watch how a decision today ripples through the organization over months or years.

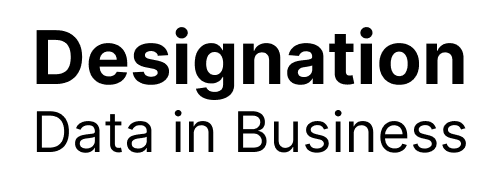
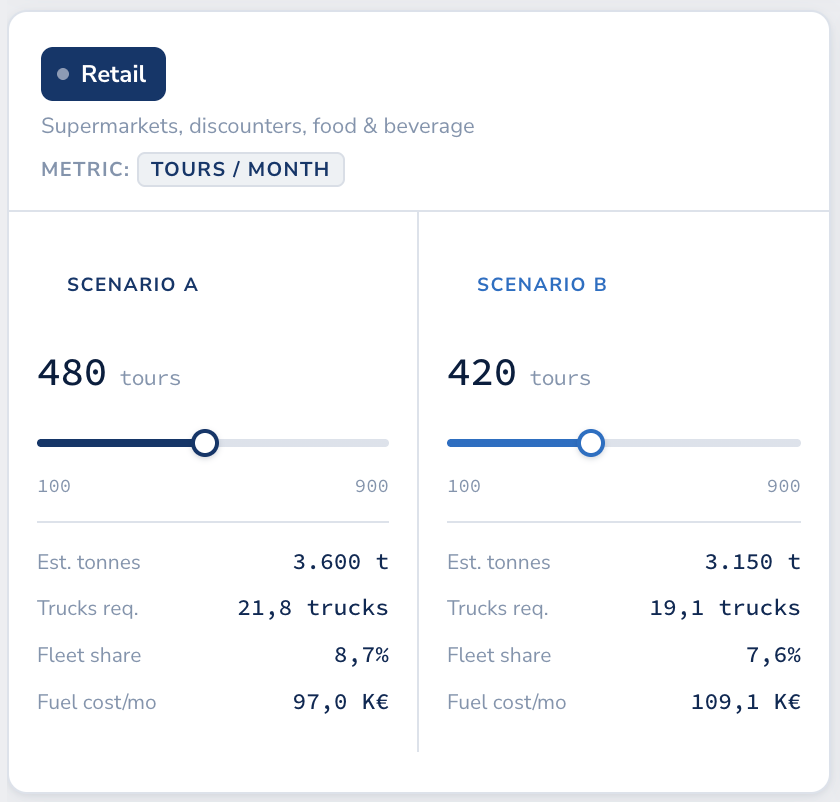
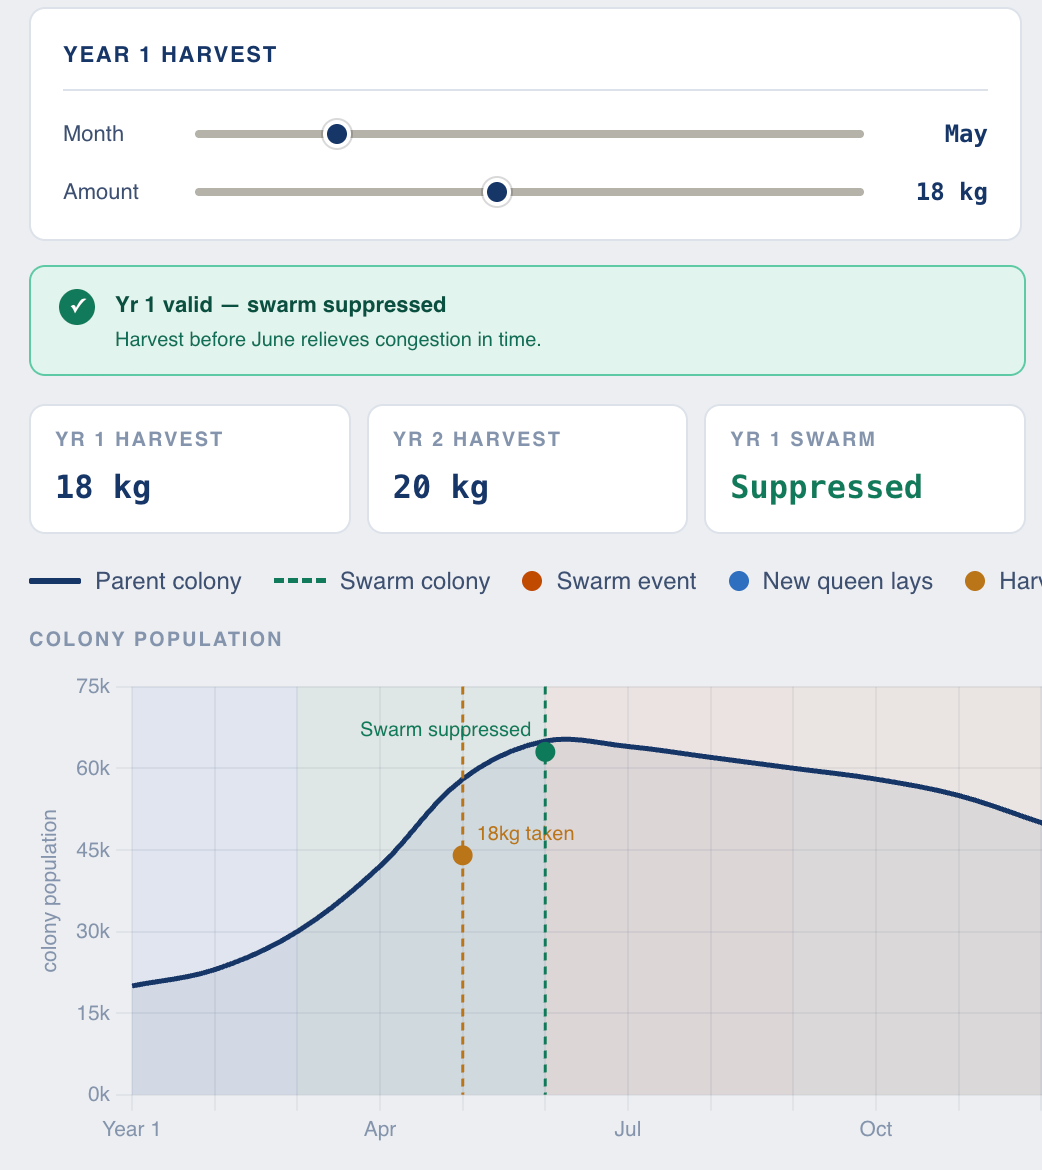
Testing decisions before making them
Scenarios allow leadership to run "what if" experiments at zero cost and zero risk. What happens to cash flow if we scale production by 30%? How does a price cut affect long-term market share when competitors react? What if demand drops suddenly? The models provide a sandbox where bad strategies fail safely β€” on screen, not in reality.

Understanding delays and unintended consequences
One of the most valuable lessons from system dynamics is that cause and effect are often separated in time. A marketing campaign may take months to affect revenue; hiring decisions play out over quarters. Bossel's models train managers to think in terms of these delays, reducing the dangerous tendency to overcorrect or panic when results don't appear immediately.

Modeling growth and limits
The logistic growth models from the System Zoo are directly applicable to market development, product adoption curves, and organizational scaling. They help businesses recognize early when they are approaching natural limits β€” market saturation, resource constraints, or capacity ceilings β€” before those limits become crises.

Simulating competition and market dynamics
Volume 3's models on competition, marketing, consumption, and escalation translate almost directly into business strategy. Companies can simulate how a price war evolves, how customer loyalty erodes, or how two competing firms co-develop in a shared market β€” insights that are very hard to gain from spreadsheets alone.

Building a shared mental model
Perhaps the most underrated benefit is organizational: when a leadership team builds and discusses a simulation together, they are forced to make their assumptions explicit. Disagreements about how the business works surface early, and consensus on strategy becomes far more grounded and robust.

Applying System Zoo thinking to business scenarios shifts decision-making from intuition-based to evidence-based β€” not through big data, but through a deeper understanding of structure, dynamics, and cause and effect over time.


System Zoo 1 β€” Business Examples
Domains πŸ›’ Procurement 🏭 Production πŸ’» SaaS hover any row for system description
🌱 Chapter 1 β€” Elementary Systems Z101 – Z117
CodeSystemBusiness Examples
Z101∫Single integration
πŸ›’ ProcurementCumulative spend accumulates as purchase orders are placed over time.
🏭 ProductionFinished goods inventory builds up as units roll off the production line.
πŸ’» SaaSTotal MRR accumulates as new subscriptions are activated each month.
Z102βš–οΈSystem state and state change
πŸ›’ ProcurementSupplier contract status shifts between active, under review, and expired.
🏭 ProductionWork-in-progress moves between production stages as throughput changes.
πŸ’» SaaSARR changes as upgrades, downgrades, and churns alter subscription value.
Z103πŸ“ˆExponential growth and decay
πŸ›’ ProcurementSupplier base shrinks exponentially as a preferred-vendor consolidation programme cuts the tail.
🏭 ProductionMachine degradation accelerates exponentially as deferred maintenance compounds.
πŸ’» SaaSUser base grows exponentially during viral product-led growth (PLG) phases.
Z104⏳Exponential delay
πŸ›’ ProcurementNew vendors only reach full capacity output after a smoothed supplier onboarding ramp-up.
🏭 ProductionA quality-improvement initiative lowers defect rate gradually, not instantly.
πŸ’» SaaSFeature adoption by existing users lags its release date by a smoothed diffusion delay.
Z105πŸ•Time-dependent growth
πŸ›’ ProcurementAnnual purchase volume ramps seasonally as Q4 budget spend accelerates toward year-end.
🏭 ProductionCapacity ramps over a fixed investment horizon as new lines come online in stages.
πŸ’» SaaSTrial-to-paid conversions follow a time-bounded free-trial window with a deadline forcing function.
Z106🐾Simple population dynamics
πŸ›’ ProcurementActive supplier count grows (new approvals) and shrinks (de-listings) as a simple stock.
🏭 ProductionWorkforce headcount driven by hiring rate minus attrition rate.
πŸ’» SaaSActive user base governed by new sign-ups minus account cancellations.
Z107🦠Infection dynamics
πŸ›’ ProcurementMaverick spending spreads virally as non-compliant purchasing behaviour is copied across teams.
🏭 ProductionA production defect propagates through batches before quality control catches it.
πŸ’» SaaSViral product adoption: each active user recruits new users via referral or word of mouth.
Z108πŸͺ£Overloading a buffer β†—
πŸ›’ ProcurementPurchase order backlog overflows when approval throughput is slower than submission rate.
🏭 ProductionIn-process queue at a bottleneck machine overflows when arrival rate exceeds cycle time.
πŸ’» SaaSSupport ticket queue floods when inbound tickets exceed agent resolution capacity.
Z109🌾Logistic growth with constant harvest
πŸ›’ ProcurementApproved supplier pool grows logistically but is continuously pruned by a fixed annual vendor review.
🏭 ProductionSkilled workforce grows logistically while a constant number retire or resign each year.
πŸ’» SaaSSubscriber base expands within a market ceiling while a fixed number of contracts expire monthly.
Z110πŸ“‰Logistic growth with stock-dependent harvest
πŸ›’ ProcurementSupplier relationships grow but churn rate rises proportionally as the portfolio becomes harder to manage.
🏭 ProductionProduct line grows logistically; complexity-driven scrap rate scales with portfolio size.
πŸ’» SaaSUser base grows but churn rate increases with size as the customer success team is stretched thin.
Z111πŸ”¬Density-dependent growth (Michaelis-Menten)
πŸ›’ ProcurementSavings realisation rate saturates as easy-win categories are optimised and diminishing returns set in.
🏭 ProductionThroughput gain from adding workers saturates due to fixed equipment constraints (bottleneck saturation).
πŸ’» SaaSNew feature adoption saturates as the addressable user segment willing to adopt it is exhausted.
Z112πŸ”Double integration and exponential delay
πŸ›’ ProcurementDemand signal takes two lagged steps (forecast β†’ order β†’ delivery) before reaching supplier production.
🏭 ProductionCapacity investment decisions lag demand signals, causing double-delay in capacity matching.
πŸ’» SaaSRevenue lags pipeline build which itself lags marketing spend β€” a two-stage delay to bookings.
Z113πŸ”„Transition from one state to another
πŸ›’ ProcurementSupplier qualification: vendors transition from "prospective" to "approved" over a vetting process.
🏭 ProductionProducts move from raw material β†’ WIP β†’ finished goods as production stages complete.
πŸ’» SaaSLeads transition through funnel stages: visitor β†’ trial β†’ paid β†’ expanded account.
Z114〰️Linear oscillator of second order
πŸ›’ ProcurementInventory bullwhip: order quantities oscillate as buyers over-correct in response to perceived shortages.
🏭 ProductionProduction scheduling oscillates between over- and under-capacity as planners react to backlog signals.
πŸ’» SaaSHeadcount planning oscillates as hiring surges are followed by freeze periods in response to growth signals.
Z115πŸ—ΊοΈState space diagram
πŸ›’ ProcurementMapping supplier risk score vs. spend concentration to visualise portfolio exposure regions.
🏭 ProductionOEE vs. WIP level phase plot to identify operating regimes (stable, congested, starved).
πŸ’» SaaSChurn rate vs. NPS phase plane to diagnose product-market fit trajectories.
Z116πŸ”€Triple integration and exponential delay
πŸ›’ ProcurementThree-tier supply chain delay: demand β†’ tier-1 order β†’ tier-2 production β†’ raw material procurement.
🏭 ProductionCapital project pipeline: investment approval β†’ engineering β†’ construction β†’ capacity goes live.
πŸ’» SaaSThree-stage revenue lag: content marketing β†’ lead β†’ opportunity β†’ closed-won revenue.
Z117🎡Linear oscillator of third order
πŸ›’ ProcurementMulti-echelon bullwhip: oscillations amplify across a three-tier supply chain due to triple integration delays.
🏭 ProductionHire–train–produce cycle creates third-order oscillations in output as workforce adjustments ripple through.
πŸ’» SaaSSpend β†’ pipeline β†’ revenue β†’ reinvestment cycle oscillates when feedback gains are mistuned.
βš™οΈ Chapter 2 β€” Physics and Engineering Z201 – Z214
CodeSystemBusiness Examples
Z201🎑Rotating pendulum
πŸ›’ ProcurementSpot vs. contract sourcing pendulum swings between extremes as commodity prices cycle.
🏭 ProductionMake vs. buy decisions rotate through insource/outsource cycles driven by cost and capacity dynamics.
πŸ’» SaaSBuild vs. buy technology strategy oscillates as in-house capability and vendor market mature.
Z202πŸŒ€Oscillator with limit cycle (van der Pol)
πŸ›’ ProcurementSupplier negotiation cycles stabilise into a recurring self-sustaining pattern of price reviews and re-bids.
🏭 ProductionShift scheduling settles into a self-sustaining overtime–recovery pattern when buffers are small.
πŸ’» SaaSSprint velocity stabilises into a limit cycle of crunch and cool-down periods each quarter.
Z203βš—οΈBrusselator
πŸ›’ ProcurementSourcing strategy oscillates between centralise and decentralise driven by autocatalytic internal politics.
🏭 ProductionQuality initiatives and defect rates interact in self-reinforcing oscillation when inspection resources are limited.
πŸ’» SaaSTechnical debt and feature velocity interact autocatalytically: more debt slows delivery, reducing revenue, cutting investment in debt repayment.
Z204πŸ”±Bistable oscillator
πŸ›’ ProcurementDual-source vs. single-source strategy flips between two stable modes depending on risk threshold.
🏭 ProductionFacility operates in either "normal run" or "expedite mode" β€” two stable states with hysteresis between.
πŸ’» SaaSProduct strategy locks into either "growth mode" or "efficiency mode" with a tipping-point transition.
Z205πŸŒͺ️Chaotic bistable oscillator (Duffing)
πŸ›’ ProcurementCommodity price under periodic supply shocks exhibits chaotic switching between high and low price regimes.
🏭 ProductionDemand-driven scheduling under seasonal forcing creates chaotic fluctuation between over- and under-capacity.
πŸ’» SaaSChurn and expansion revenue driven by periodic campaigns show chaotic sensitivity to campaign timing.
Z206🌦️Heat, weather, and chaos (Lorenz)
πŸ›’ ProcurementGlobal commodity markets exhibit Lorenz-like sensitivity: small geopolitical events cause unpredictable price spirals.
🏭 ProductionInterplay of demand, capacity, and inventory in a multi-echelon network produces chaotic, weather-like fluctuations.
πŸ’» SaaSThree coupled metrics (acquisition, activation, retention) exhibit sensitive dependence β€” small onboarding changes cascade chaotically into LTV.
Z207πŸ¦‹Chaotic attractor (RΓΆssler)
πŸ›’ ProcurementSupplier pricing, lead time, and quality oscillate around a strange attractor under periodic contract renegotiations.
🏭 ProductionWIP, throughput, and cycle time spiral around a chaotic attractor when production control is loosely tuned.
πŸ’» SaaSSales velocity, pipeline coverage, and quota attainment evolve chaotically when incentive structures create non-linear feedback.
Z208⚑Coupled dynamos and chaos
πŸ›’ ProcurementTwo interdependent procurement hubs (Europe and Asia) mutually amplify ordering chaos through shared suppliers.
🏭 ProductionTwo coupled production lines sharing a common buffer can generate chaotic throughput swings.
πŸ’» SaaSTwo competing SaaS products sharing a developer ecosystem drive each other into chaotic release cadences.
Z209🀸Balancing an inverted pendulum
πŸ›’ ProcurementJust-in-time procurement is inherently unstable: without continuous rebalancing, stockouts or excess build up rapidly.
🏭 ProductionLean zero-buffer production requires continuous active scheduling to remain on target β€” it cannot run on autopilot.
πŸ’» SaaSMaintaining CAC:LTV balance in a high-growth phase requires constant active adjustment of spend and pricing.
Z210πŸͺOptimizing glider flight: search for thermals
πŸ›’ ProcurementCategory managers search for cost-saving opportunities (thermals) while managing baseline spend (glide path).
🏭 ProductionLean improvement teams seek efficiency pockets while sustaining baseline OEE during exploration.
πŸ’» SaaSGrowth teams alternate between exploiting high-converting channels (thermals) and exploring new acquisition vectors.
Z211✈️Flight dynamics
πŸ›’ ProcurementStrategic sourcing has pitch (cost focus), roll (risk balance), and yaw (supplier diversity) axes of control.
🏭 ProductionPlant operations steered across three axes: throughput rate, quality level, and schedule adherence.
πŸ’» SaaSCompany trajectory governed by three coupled controls: revenue growth, burn rate, and NPS β€” analogous to lift, drag, and thrust.
Z212🏠House heating dynamics
πŸ›’ ProcurementSupplier pipeline is "heated" by sourcing activity and cools through attrition β€” thermostat logic controls intake rate.
🏭 ProductionProduction rate is throttled like a thermostat to maintain target inventory level against variable demand (heat loss).
πŸ’» SaaSOnboarding pipeline is kept "warm" by marketing; churn acts as heat loss; the CS team acts as the thermostat.
Z213πŸ”₯Integral relations and heat conduction
πŸ›’ ProcurementCost pressure propagates through supply chain tiers like heat conduction β€” slowly diffusing from buyer to sub-tier suppliers.
🏭 ProductionProcess improvement diffuses spatially across a factory floor as knowledge spreads between work centres.
πŸ’» SaaSChurn risk conducts from power users to casual users as product value erodes β€” visible in cohort heat maps.
Z214πŸ’¨Boundary layer flow
πŸ›’ ProcurementPolicy compliance drops near the "edges" of the organisation (remote teams, small spend categories) like a boundary layer.
🏭 ProductionQuality consistency degrades near shift boundaries and handover points β€” analogous to boundary layer turbulence.
πŸ’» SaaSUser engagement thins near the edges of product usage (low-frequency users, edge features) mirroring laminar-to-turbulent boundary flow.

This scenario planner is build within a website. You can get this inΒ specific applications (f.e. Power BI) as well.Β 


Hartmut Bossel and the System Zoo

Hartmut Bossel, born on 3 March 1935, is a German environmental scientist and systems scientist. WikipediaΒ  He taught for many years at the University of California in Santa Barbara and at the University of Kassel, Germany, where he served as director of the Center for Environmental Systems Research until his retirement. AmazonΒ  Remarkably, Bossel and his co-author Florentin Krause are also credited with coining the term Energiewende β€” describing the transformation of German energy policy β€” back in 1980. WikipediaΒ 

His most enduring contribution to the field of systems science is the System Zoo, a three-volume collection of simulation models published in 2007. Mathematical modeling and computer simulation make it possible to understand and control the dynamic processes taking place in complex systems, and the System Zoo puts this principle into practice with roughly one hundred fully documented simulation models drawn from all areas of life. Google BooksΒ  The models can be run using freely available system dynamics software, making them widely accessible.

The three volumes span an impressive range of domains: Volume 1 covers elementary processes and complex systems from physics and engineering, including exponential and logistic growth, oscillations, delays, limit cycles, and chaotic attractors. Google BooksΒ  Volume 2 focuses on climate, ecosystems, and resources β€” from the water cycle and carbon cycle to predator-prey dynamics and the exploitation of renewable and nonrenewable resources. Google BooksΒ  Volume 3 addresses economic and social systems and global development, including models of competition, debt crises, globalization, and the landmark world models of the Club of Rome. AmazonΒ 

The System Zoo collection is particularly well-suited for teaching, training, and research projects at all levels, from high school to university, as well as for individual study AmazonΒ  β€” a true menagerie of dynamic systems, inviting anyone curious about how the world works to step inside and explore.

Get in touch, if this sounds relevant.

We are glad to hear about your project.

Let us know if we can help and we come back how your project would look like. No long intake forms.

Mail to office @designation.eu

Β